Mention rate measures the percentage of eligible AI responses that name a brand, while citation rate measures the percentage that cite an owned domain.
The short answer
- Mention rate measures the percentage of eligible AI responses that name a brand, while citation rate measures the percentage that cite an owned domain.[1]
- AI share of voice is not standardized: some vendors count brand appearances, while others use modeled search-volume-weighted impressions.[3][5]
- AI visibility scores are not comparable unless the numerator, denominator, platform mix, prompt set, weighting, and scoring model are disclosed.[1]
- Average position should be reported with mention rate and repeat-run variation because AI-generated brand lists and ordering can change substantially between runs.[1][5]
- Leadership reports should separate presence, prominence, portrayal, and verified outcomes such as AI-referred sessions, key events, and revenue.[1]
The metrics that matter most are mention rate, citation rate, share of voice, position, portrayal, and verified AI-referred outcomes—but only when each metric has a documented formula, denominator, prompt set, platform mix, and sampling method. AI visibility is not a standardized score: vendors use different definitions for the same labels, so a 70 from one platform may not be comparable with a 70 from another.[1]
This guide explains the common AI visibility metrics, shows how to calculate them, identifies the main pitfalls, and recommends a reporting structure for leadership.
What is AI visibility?
AI visibility is the measured presence and prominence of a brand, product, or website in answers generated by systems such as ChatGPT, Google AI Overviews, Google AI Mode, Claude, Gemini, and Perplexity. Depending on the vendor, visibility may mean a brand mention, a domain citation, both combined, or a composite score that also includes position and competitive context.[1]
The basic observation unit is usually an AI response generated from a tracked prompt. A measurement program should define whether it counts one response, one prompt run, one brand appearance, one cited page, or an estimated impression. These choices determine the denominator and can materially change the result.[1]
AI visibility matters because generative answers can influence consideration before a user visits a website. However, visibility is an upstream indicator rather than proof of traffic, conversion, or revenue. Google Analytics separately reports identifiable AI Assistant referrals, while Google’s AI Assistant channel excludes Google AI Overviews and AI Mode.[2]
Which AI visibility metrics should you track?
The following definitions are useful internal standards. They are not universal vendor formulas, so record the exact methodology beside every reported value.
| Metric | Formula | What it tells you | Main pitfall |
|---|---|---|---|
| Mention rate | Responses naming the brand ÷ eligible responses × 100 | How often the brand appears in sampled answers | Changing the prompt panel, engines, or answer count changes the denominator.[1] |
| Share of voice | Brand appearances ÷ appearances for all tracked brands × 100 | The brand’s share of observed competitive presence | Some tools use impressions or search-volume weighting rather than simple appearances.[3][1] |
| Citation rate | Responses citing an owned domain ÷ eligible responses × 100 | How often the brand’s website is used as a source | Citation rate is not citation share, citation count, or the average number of citations in cited answers.[4] |
| Average position | Sum of brand positions ÷ responses where the brand appears | Where the brand is listed when present | It excludes absent responses and can look strong even when mention rate is low.[5][1] |
| Sentiment | Vendor-specific; one example is (positive mentions − negative mentions) ÷ total mentions × 100 | How the brand is portrayed in generated answers | A score of 70 may mean 70% positive or a net score of +70, depending on the vendor.[6] |
| Visibility score | Vendor-specific composite or rate | A simplified view of presence, prominence, or both | There is no standard formula, denominator, or platform weighting.[1] |
| Citation share | Brand-domain citations ÷ all tracked citations × 100 | The brand’s share of cited sources | It measures source authority within the sample, not necessarily brand mentions or traffic.[1] |
| AI-referred sessions | Sessions attributed to recognized AI referral sources | Measurable website visits from identifiable AI services | It misses unattributed influence and excludes Google AI Overviews and AI Mode from the default AI Assistant channel.[2] |
| AI-referred revenue | Revenue associated with identifiable AI referral sessions | Observed commercial outcomes from trackable referrals | It does not capture users influenced by AI who later return through another channel.[7] |
Mention rate: the clearest starting point
Mention rate is the percentage of eligible AI responses that name a brand at least once:
[ \text{Mention rate} = \frac{\text{Responses naming the brand}} {\text{Eligible AI responses}} \times 100 ]
Finseo and Ahrefs both describe response-level counting approaches in which a response counts once even if the brand appears multiple times.[4] This makes mention rate relatively easy to explain: it answers, “In what percentage of sampled answers did the brand appear?”
Mention rate is usually more useful than a raw mention count because it normalizes for the number of prompts and responses. Still, it is only comparable across periods when the prompt set, engines, locations, language, response frequency, and eligibility rules remain consistent.[8]
A brand can have a high mention rate in informational prompts but a low rate in comparison or transactional prompts. Report the result by intent rather than combining every query into one headline number. The IAB recommends covering informational, comparison, recommendation, and transactional intent types in decision-grade measurement.[1]
Share of voice: useful for competitive context
A simple AI share-of-voice calculation is:
[ \text{SOV} = \frac{\text{Brand appearances}} {\text{All tracked brand appearances}} \times 100 ]
Peec uses a count-based version based on brand mentions, while Finseo describes a version based on answers naming the brand relative to answer appearances for tracked brands.[1]
The competitive set must be stated. “Share of voice” among three named competitors is not equivalent to share of voice across every brand detected by an engine. A change in the competitor list can alter the result even if the brand’s own performance does not change.[3]
Some vendors use a different concept. Ahrefs Brand Radar calculates AI share of voice using estimated impressions and weights platforms by impression volume.[9] Those impressions are modeled from search demand, so they represent potential exposure rather than actual AI audience reach, clicks, or revenue.[9]
For leadership, show both the brand’s SOV and the competitive set beneath it. Otherwise, the number can appear more precise than it is.
Citation rate: measure earned source visibility
Citation rate measures how often an AI response cites an owned domain:
[ \text{Citation rate} = \frac{\text{Responses citing an owned domain}} {\text{Eligible AI responses}} \times 100 ]
Finseo publishes this response-based approach, while OtterlyAI uses a related Domain Coverage measure.[1][8]
Citation rate is different from citation share. Citation rate asks how often the brand’s domain appears in an eligible response. Citation share asks what percentage of all observed citations belong to that domain.[1] A domain can have a high citation rate in a narrow prompt set but a low citation share across a broad category.
Citations and mentions should always be reported separately. A brand can be named without its website being cited, and a domain can be cited without the brand being explicitly named.[10] Semrush’s 2026 index reported that the overlap between mentioned brands and cited domains can be as low as 30% on Gemini, illustrating why one measure cannot substitute for the other.[11]
Average position: descriptive, not definitive
Average position is generally calculated only for responses in which the brand appears:
[ \text{Average position} = \frac{\text{Sum of observed brand positions}} {\text{Responses where the brand appears}} ]
Finseo and OtterlyAI both describe present-only position calculations.[4] A lower numerical value usually indicates an earlier appearance, but position should not be treated as a stable universal ranking.
SparkToro found that fewer than one in 100 pairs of ChatGPT or Google AI responses produced the same brand list, while matching order occurred at roughly one in 1,000 runs.[5] Consequently, an average position of 2.1 may conceal substantial run-to-run variation.
Always pair average position with mention rate and repeat counts. A brand appearing first in 10% of responses may be less strategically important than one appearing fourth in 70% of responses.
Sentiment, framing, and factual accuracy
Sentiment attempts to classify how an AI system describes a brand. OtterlyAI’s Net Sentiment Score uses a scale from -100 to +100:
[ \text{Net sentiment} = \frac{\text{Positive mentions} - \text{Negative mentions}} {\text{Total mentions}} \times 100 ]
Profound describes a different positive-share approach on a 0–100 scale, averaged across platforms and weighted by claim frequency.[1] These scores cannot be compared without knowing the scoring model.
Sentiment should not be used as a substitute for factual accuracy. A favorable answer may still contain outdated, unsupported, or incorrect claims. The IAB framework separates portrayal measures such as sentiment and framing from factual inaccuracy and hallucination indicators.[1]
For regulated, high-risk, or reputation-sensitive categories, report:
- Sentiment or tone.
- Positive, neutral, and negative framing.
- Factual inaccuracies.
- Unsupported claims.
- Recommendation strength.
- The evidence or answer excerpts behind material changes.
Why do AI visibility scores differ between vendors?
The same label can describe different quantities because vendors vary in four fundamental ways:
- Response universe: Some providers divide by all responses, while others divide only by responses that mention at least one brand.[5]
- Visibility definition: Some count a brand mention, while Finseo counts a brand mention or an owned-domain citation.[4]
- Weighting: Some tools count appearances equally, while Ahrefs models potential impressions using search-volume data.[1]
- Composite scoring: Some indexes combine coverage, position, platform weighting, or competitive benchmarks without publishing a complete formula.[1][7]
Peec defines visibility as responses mentioning a brand divided by all responses.[1] Profound uses responses mentioning the brand divided by responses mentioning at least one brand.[1] Semrush describes AI Visibility as a 0–100 benchmark relative to competitors but does not publish the denominator on the cited metric page.[1] Finseo includes either a brand mention or an owned-domain citation in visibility, while keeping mention rate and citation rate separate.[1]
These are not interchangeable scores. Before comparing two vendors, ask whether they use the same engines, prompts, locations, repeat schedule, denominator, citation rule, and position treatment.
How much sampling variance should you expect?
AI responses are stochastic: the same prompt can produce different brand lists, rankings, wording, and citations at different times. SparkToro advises repeating a prompt approximately 60–100 times when studying a recommendation set, but describes that number as a practical heuristic rather than a universal statistical threshold.[1]
The IAB recommends reporting distributions and ranges rather than a single number. It characterizes fewer than 50 queries as exploratory and calls for documentation of response counts, repeated-query variability, prompt methodology, platform mix, and confidence.[1]
How should sampling variance be reported?
Report the number of distinct prompts, repeats per prompt, total responses, platforms, locations, date range, and the observed range or confidence interval. For example, state that mention rate was 42% across 100 prompts and five repeats per prompt, with platform-specific results ranging from 35% to 49%. Do not present one run or one daily score as a definitive ranking.[5]
Aggregate patterns may be more stable than individual answer lists. A 2026 Journal of Marketing Analytics study reported a 0.994 correlation between aggregate brand inclusion shares across two measurement periods, while cross-system agreement was substantially lower.[12] This suggests that repeated measurement can reveal durable category patterns even when individual answers remain unstable. Finseo’s own study of about 1.4 million German-language (DACH) AI answers points the same way for citations: the share of cited URLs still cited the next day for the same prompt ranged from 65.5% on Perplexity to 31.6% on Google AI Overviews, and on ChatGPT a single day of visibility missed the following fortnight by 16 points on average.
How should AI visibility connect to traffic and revenue?
Visibility and outcomes should be maintained as separate measurement layers:
- Answer presence: mention rate, SOV, citations, and position from a fixed prompt panel.
- Referral activity: AI Assistant sessions, engaged sessions, key events, and source/medium data in GA4.[13]
- Commercial outcomes: conversions and revenue associated with identifiable referral sessions.[2][7]
Google’s AI Assistant channel recognizes services including ChatGPT, Gemini, DeepSeek, Copilot, and Grok, using the ai-assistant medium and (ai-assistant) campaign value.[14] It does not include Google AI Overviews or AI Mode, and some assistant visits may remain under Referral or lack usable referrer information.[2][3] Finseo’s own review of six studies on the AI attribution gap estimates that analytics records only about 1 in 10 AI-driven conversions.
Do not label unidentified Direct traffic as AI traffic. Do not claim that a visibility score caused revenue. Practitioner analyses have reported correlations between AI share of voice and traffic, but other analyses have failed to establish a reliable relationship across tested brands.[9][1] Correlation is therefore a useful research signal, not proof of causation.
What should you report to leadership?
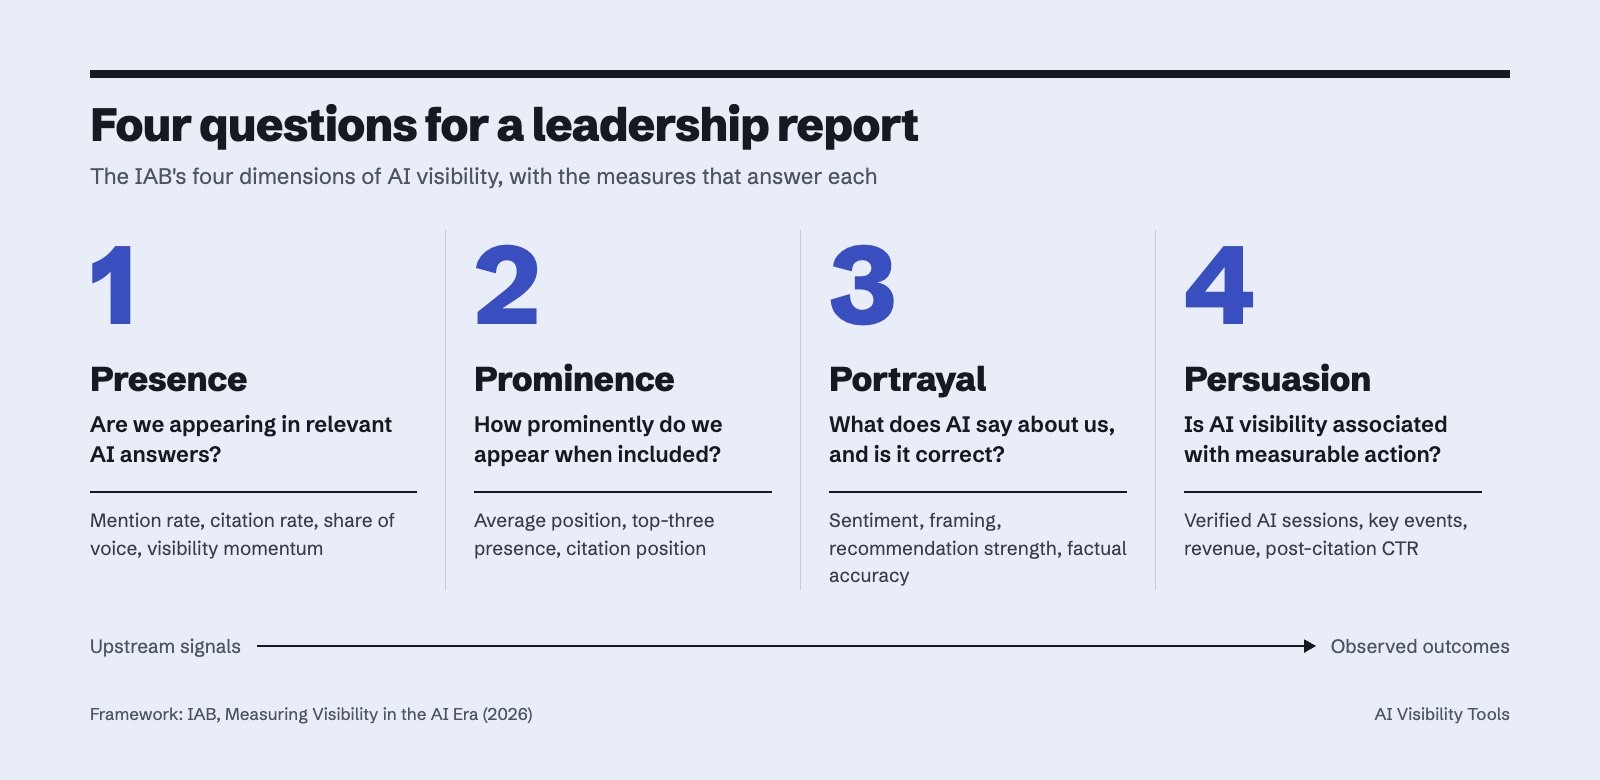
The IAB framework organizes measurement into four dimensions: Presence, Prominence, Portrayal, and Persuasion.[1] This structure is more transparent than presenting one opaque AI visibility score.
| Dimension | Recommended measures | Leadership question |
|---|---|---|
| Presence | Mention rate, citation rate, SOV, visibility momentum | Are we appearing in relevant AI answers? |
| Prominence | Average position, top-three presence, citation position | How prominently do we appear when included? |
| Portrayal | Sentiment, framing, recommendation strength, factual accuracy | What does AI say about us, and is it correct? |
| Persuasion | Verified AI sessions, key events, revenue, post-citation CTR | Is AI visibility associated with measurable action? |
A concise executive scorecard should lead with observed outcomes, then show upstream indicators:
- Verified AI-referred sessions, key events, and revenue.
- Mention rate and SOV by platform and intent.
- Citation rate, citation share, and the pages most often cited.
- Position and repeat-run distribution.
- Sentiment, framing, and factual accuracy.
- Query count, repeat count, platform coverage, formula, and confidence range.
How should you set up recurring AI visibility reporting?
- Define the business question. Decide whether the program measures category presence, competitive recommendation, source authority, reputation, or measurable referral outcomes.
- Create a fixed prompt panel. Include informational, comparison, recommendation, and transactional prompts, and document the intent assigned to each query.[1]
- Set the response universe. Record the engines, model or surface, market, language, date range, eligibility rule, and repeat schedule. Surface matters even within one vendor: Finseo’s own analysis found that Google AI Mode and AI Overviews share only 13.7% of cited URLs on the same query.
- Separate the metrics. Track mention rate, citation rate, SOV, position, sentiment, and referrals independently instead of hiding them in one score.
- Repeat prompts. Use repeated runs to estimate variance, and report ranges or distributions rather than a single answer or rank.[8]
- Audit vendor formulas. Record each provider’s numerator, denominator, weighting, citation definition, and treatment of missing or non-triggered answers.
- Connect outcomes carefully. Compare visibility with verified AI referral sessions, key events, and revenue without relabeling unattributed traffic.[3]
- Build an evidence trail. Retain prompt versions, timestamps, response samples, cited URLs, classification rules, and changes to the tracked competitor set.
- Report confidence with performance. Put query count, repeat count, platform coverage, and sampling range next to every headline metric.
- Review the panel periodically. Add emerging intents and products, but preserve a stable core panel so period-over-period changes remain interpretable.
Finseo is one example of a platform that separates visibility, mention rate, citation rate, share of voice, average position, and sentiment rather than treating them as one universal metric.[1] Finseo is built by the team behind this site.
Which metrics matter most by use case?
- Brand awareness: mention rate and SOV by platform and intent.
- Content authority: citation rate, citation share, cited pages, and source categories.
- Competitive positioning: SOV, head-to-head presence, and average position with repeat variation.
- Reputation management: sentiment, framing, factual accuracy, and recurring negative claims.
- Demand generation: verified AI Assistant sessions, key events, revenue, and post-citation CTR where available.[1]
- Executive reporting: observed outcomes first, followed by presence, citations, portrayal, and measurement confidence.
- Vendor evaluation: formula transparency, prompt controls, engine coverage, repeat methodology, exports, and the ability to inspect underlying answers.
Frequently asked questions
What is the most important AI visibility metric?
There is no single best metric for every brand. Mention rate is the clearest measure of answer-level presence, citation rate measures source visibility, and verified AI-referred conversions or revenue are stronger outcome measures when they can be observed.[1] Report them together rather than substituting one for the others.
Is AI visibility the same as mention rate?
No. Some vendors use visibility as a mention rate, while others include domain citations or combine presence with position and competitive weighting.[1][3] Always inspect the vendor’s formula and denominator before comparing an AI visibility score with mention rate.
How is AI share of voice calculated?
A common count-based formula divides a brand’s appearances by all tracked brand appearances and multiplies by 100.[15] Other systems, including Ahrefs Brand Radar, use estimated search-volume-weighted impressions, so the result represents modeled potential exposure rather than the same quantity as count-based SOV.[9]
What is the difference between mention rate and citation rate?
Mention rate measures the percentage of eligible answers that name the brand. Citation rate measures the percentage of eligible answers that cite an owned domain.[10][1] A brand can be mentioned without its website being cited, and a website can be cited without an explicit brand mention.[1][10]
How many prompts are needed to measure AI visibility?
The IAB characterizes fewer than 50 queries as exploratory and recommends reporting platform- and intent-level results with repeated-response variation.[1] SparkToro suggests repeating prompts approximately 60–100 times for recommendation-set analysis, but that is a practical heuristic rather than a universal sample-size rule.
Can AI visibility metrics prove that AI generated revenue?
No. Visibility metrics show presence or prominence in sampled answers, while GA4 AI Assistant data shows identifiable referral activity and associated outcomes.[3][7] AI can influence users who later arrive through Direct, organic search, or another channel, so correlations should not be presented as proof that visibility caused revenue.[1][7]
Sources
- 1Executive Summary — iab.com
- 2How to find referral traffic in GA4, including AI - George Kelly — iamgeorgekelly.com
- 3How to measure AI search visibility: KPIs & reporting — semrush.com
- 4KPIs & Metrics Explained — AI Visibility Measurement — docs.finseo.ai
- 5NEW Research: AIs are highly inconsistent when recommending brands or products; marketers should take care when tracking AI visibility - SparkToro — sparktoro.com
- 6Definition of Brand Report KPIs — help.otterly.ai
- 7How to build a meaningful AI search visibility dashboard — searchengineland.com
- 8Characterizing Web Search in the Age of Generative AI — aclanthology.org
- 9Ahrefs Brand Radar Methodology: How we collect and model AI visibility data — ahrefs.com
- 10Metrics Overview — docs.peec.ai
- 11Semrush Releases Expanded 2026 AI Visibility Index, Analyzing 126 Million AI Search Prompts — semrush.com
- 12The synthesised consideration set: brand inclusion and concentration in large language model recommendations across five industries and three systems | Journal of Marketing Analytics | Springer Nature Link — link.springer.com
- 13[GA4] Traffic acquisition report - Computer - Analytics Help — support.google.com
- 14Default channel group - Analytics Help — support.google.com
- 15Glossary - Profound — help.tryprofound.com